'outlier': R function for univariate outliers detection (DOI: 10.13140/RG.2.2.24199.39847)
'outlier' is an R function which allows to perform univariate outliers detection using three different methods. These methods are those described in R. R. Wilcox, Fundamentals of Modern Statistical Methods: Substantially Improving Power and Accuracy, Springer 2010 (2nd edition), at pages 31-35. Two of the three methods are robust, and are therefore less prone to the masking effect.
The function is quite straightforward:
outlier(x, method, addthres)
where
x: is a vector storing the data;
method: sets the outlier detection method, either the mean-based (mean), median-based (median), or boxplot-based (boxplot) one;
addthresh: takes FALSE (default) or TRUE if user does not want or does want some threshold lines be added to the returned chart (see below).
Following Wilcox's treatment of the topic, let's assume we have a simple dataset consisting of the following values, stored in an object named mydata:
2,3,4,5,6,7,8,9,10,50
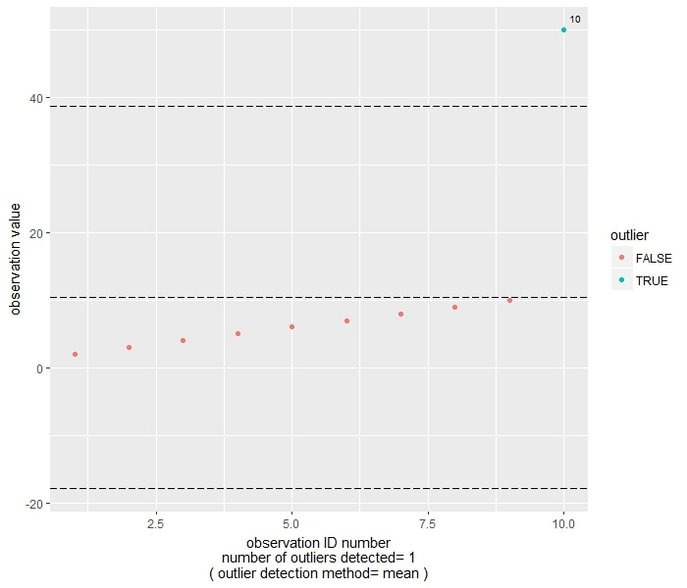
We can use the function to spot outliers. Let's consider the mean-based method first:
outlier(mydata, method="mean", addthres=TRUE)
We get the following plot, where the observation points are ordered on the basis of their ID number, and a different color is given if they can be considered outliers according to the mean method. In this case, an observation is considered outlier if the absolute difference between that observation and the sample mean is more than 2 Standard Deviations away (in either direction) from the mean. In this case, observation number 10 (corresponding to 50) is flagged as outlier. In the plot, the central reference line is indicating the mean value, while the other two are set at mean-2*SD and mean+2*SD.
The function is quite straightforward:
outlier(x, method, addthres)
where
x: is a vector storing the data;
method: sets the outlier detection method, either the mean-based (mean), median-based (median), or boxplot-based (boxplot) one;
addthresh: takes FALSE (default) or TRUE if user does not want or does want some threshold lines be added to the returned chart (see below).
Following Wilcox's treatment of the topic, let's assume we have a simple dataset consisting of the following values, stored in an object named mydata:
2,3,4,5,6,7,8,9,10,50
We can use the function to spot outliers. Let's consider the mean-based method first:
outlier(mydata, method="mean", addthres=TRUE)
We get the following plot, where the observation points are ordered on the basis of their ID number, and a different color is given if they can be considered outliers according to the mean method. In this case, an observation is considered outlier if the absolute difference between that observation and the sample mean is more than 2 Standard Deviations away (in either direction) from the mean. In this case, observation number 10 (corresponding to 50) is flagged as outlier. In the plot, the central reference line is indicating the mean value, while the other two are set at mean-2*SD and mean+2*SD.
The problem with the preceding method is that is more prone to the masking issue, whereby outlying observations can indeed conceal themselves by inflating the standard deviation.
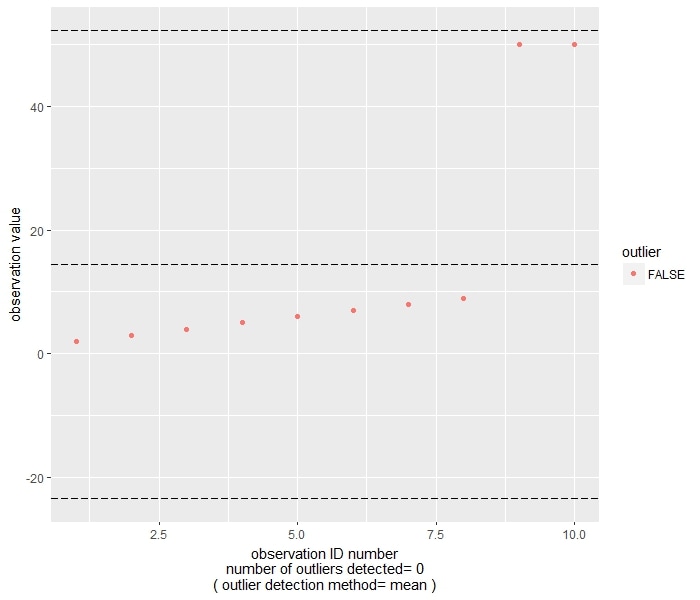
Let's consider the following example, again after Wilcox's treatment of the topic. If we take the previous small datset, and replace 10 with 50, the following chart is returned by the function. Due to the masking effect, the two 50 are not flagged as outliers.
Let's consider the following example, again after Wilcox's treatment of the topic. If we take the previous small datset, and replace 10 with 50, the following chart is returned by the function. Due to the masking effect, the two 50 are not flagged as outliers.
Two more robust methods are implemented by the function: the median-based and the boxplot-based.
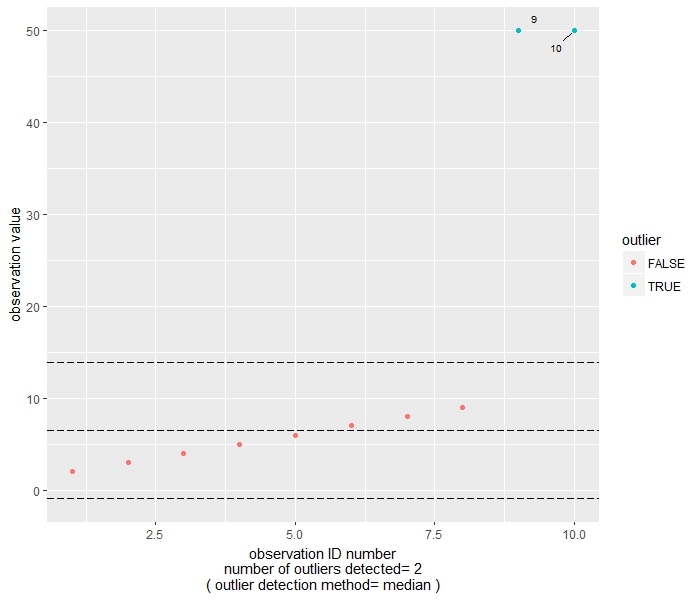
Given the preceding dataset 2,3,4,5,6,7,8,9,50,50, let's run the function to use the two more robust methods, using the following commands:
outlier(mydata, method="median", addthres=TRUE)
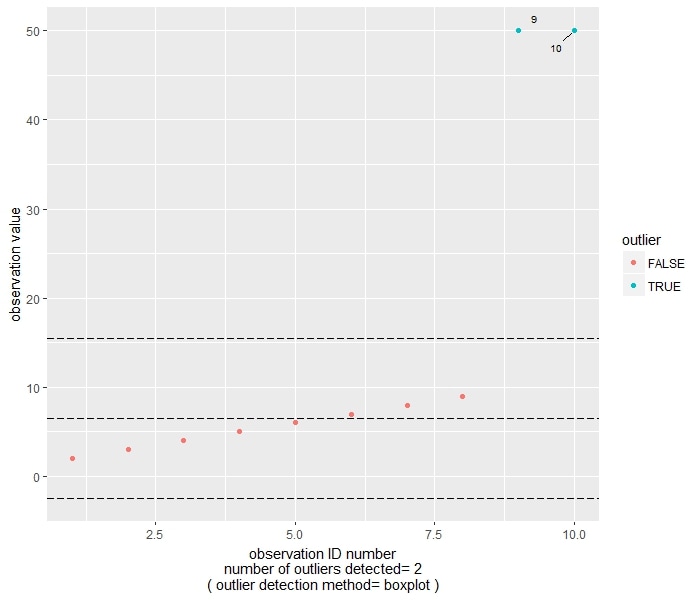
outlier(mydata, method="boxplot", addthres=TRUE)
As you can see, both methods flag observation 9 and 10 (that is, the two 50) as outliers.
The median-based method considers an observation as being outlier if the absolute difference between the observation and the sample median is larger than the Median Absolute Deviation divided by 0.6745. In this case, the central reference line is set at the median, while the other two are set at median-2*MAD/0.6745 and median+2*MAD/0.6745.
The boxplot-based method consider an observation as being an outlier if it is either smaller than the 1st Quartile minus 1.5 times the InterQuartile Range, or larger than the 3rd Quartile minus 1.5 times the InterQuartile Range. In the plot, the central reference line is set at the median, while the other two are set at 1Q-1.5*IQR and 3Q+1.5*IQR.
Given the preceding dataset 2,3,4,5,6,7,8,9,50,50, let's run the function to use the two more robust methods, using the following commands:
outlier(mydata, method="median", addthres=TRUE)
outlier(mydata, method="boxplot", addthres=TRUE)
As you can see, both methods flag observation 9 and 10 (that is, the two 50) as outliers.
The median-based method considers an observation as being outlier if the absolute difference between the observation and the sample median is larger than the Median Absolute Deviation divided by 0.6745. In this case, the central reference line is set at the median, while the other two are set at median-2*MAD/0.6745 and median+2*MAD/0.6745.
The boxplot-based method consider an observation as being an outlier if it is either smaller than the 1st Quartile minus 1.5 times the InterQuartile Range, or larger than the 3rd Quartile minus 1.5 times the InterQuartile Range. In the plot, the central reference line is set at the median, while the other two are set at 1Q-1.5*IQR and 3Q+1.5*IQR.
|
|
Besides the chart, the function will return some objects relevant to the analysis' results:
-a dataframe (stored in an object named dtf) containing the list of observation with a separate column indicating whether or not the corresponding value is an outlier;
-three vectors (named lower, midp, upper) storing the values corresponding to the three aforementioned thresholds (according to the chosen outlier identification method);
-a vector (named outliern) containing the number of outliers detected (which is also reported in the chart returned by the function).
The function can be downloaded HERE. Alternatively, you can copy/paste the code below. Please note that the 'ggplot2' and 'ggrepel' packages must be already installed in R in order for the function to work properly.
outlier <- function (x,method="mean",addthres=FALSE){
if (method=="mean") {
avrg <- mean(x)
stdev <-sd(x)
dtf <<- data.frame(ID=seq.int(length(x)), obs=x, outlier=abs(x-avrg)>2*stdev)
midp <<- avrg
lower <<- avrg-2*stdev
upper <<- avrg+2*stdev
outliern <<- length(which(dtf=="TRUE"))
} else {}
if (method=="median") {
med <- median(x)
MAD <-median(abs(med-x))
dtf <<- data.frame(ID=seq.int(length(x)), obs=x, outlier=abs(x-med)>2*(MAD/0.6745))
midp <<- med
lower <<- med-2*(MAD/0.6745)
upper <<- med+2*(MAD/0.6745)
outliern <<- length(which(dtf=="TRUE"))
} else {}
if (method=="boxplot") {
Q1 <- quantile(x, 0.25)
Q3 <- quantile(x, 0.75)
IntQ <-Q3-Q1
dtf <<- data.frame(ID=seq.int(length(x)), obs=x, outlier=x<Q1-1.5*IntQ | x>Q3+1.5*IntQ)
midp <<- median(x)
lower <<- Q1-1.5*IntQ
upper <<- Q3+1.5*IntQ
outliern <<- length(which(dtf=="TRUE"))
} else {}
if (addthres==TRUE) {
p <- ggplot(dtf, aes(x=ID, y=obs, label=ID)) + geom_point(aes(colour=outlier)) + geom_text_repel(data = subset(dtf, outlier=="TRUE"), aes(label = ID), size = 2.7, colour="black", box.padding = unit(0.35, "lines"), point.padding = unit(0.3, "lines")) + labs(x=paste("observation ID number\n number of outliers detected=", outliern, "\n( outlier detection method=", method, ")"), y="observation value") + geom_hline(yintercept = midp, colour="black", linetype = "longdash") + geom_hline(yintercept = lower, colour="black", linetype = "longdash") + geom_hline(yintercept = upper, colour="black", linetype = "longdash")
} else {
p <- ggplot(dtf, aes(x=ID, y=obs, label=ID)) + geom_point(aes(colour=outlier)) + geom_text_repel(data = subset(dtf, outlier=="TRUE"), aes(label = ID), size = 2.7, colour="black", box.padding = unit(0.35, "lines"), point.padding = unit(0.3, "lines")) + labs(x=paste("observation ID number\n( outlier detection method=", method, ")"), y="observation value") #requires 'ggrepel'
}
return(p)
}
Have you found this website helpful? Consider to leave a comment in this page.
