Interpreting the CA scatterplot (continued): correlation between row profiles and dimensions |
|
The next step is to consider the correlation between the row profiles and the dimensions. This means that, after having given “names” to the dimensions (i.e., after having located what column category has determined the dimensions), we can understand how row categories (sites, in our example) relate to the dimensions. This can be done by inspecting the bar plot provided by the script, where the correlation (ranging from 0.0 to 1.0) between row categories and the dimensions is displayed.
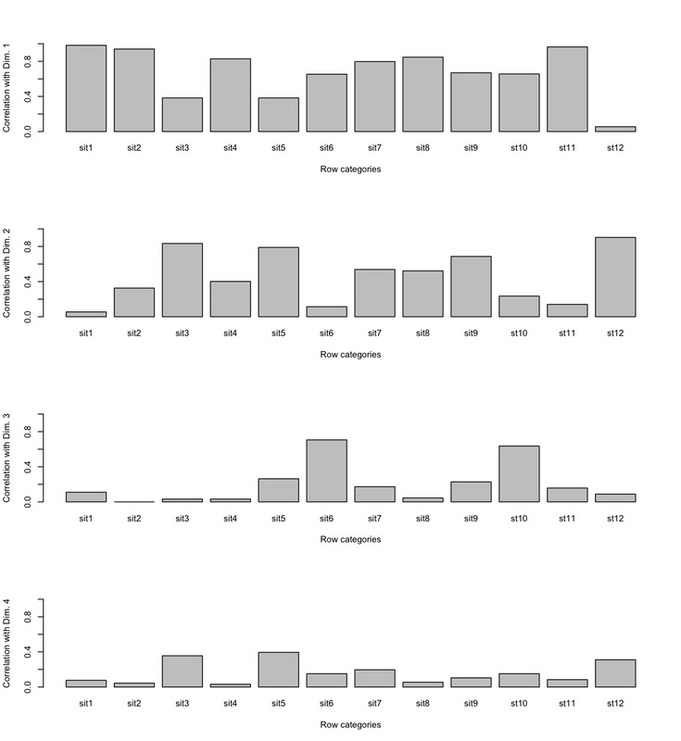
The reader is referred to Greenacre (2007, 86) for a full coverage of the way in which CA computes these figures. It suffices here to stress that almost all the sites (i.e. row categories) have a strong correlation with the first dimension, with the exception of site 3, 5, and 12. These have a strong correlation with the second dimension instead. The analyst may refer back to the CA scatterplot to have an idea to which pole of the dimensions these correlations refer.
Have you found this website helpful? Consider to leave a comment in this page.
