Extension: clustering rows and/or columns |
The script
provides the facility to perform a cluster analysis (Baxter 1994, 140-184; Shennan 1997, 216-264; Drennan 2009, 309-320)
over the CA results. This is accomplished via the ‘FactoMineR’ package. Often
the user could be interested in isolating clusters of points on the CA
scatterplot (see, e.g., Wallin
2010, 70). To keep with our example, he could be willing to indicate on the
scatterplot groups of sites that are similar in terms of their assemblage
profiles. This could be accomplished in an informal way, grouping “by eye” the
points lying one near the other on the plot. Indeed users may require a more
formal method.
Greenacre (1988; 2007, 113-120) describes a method particularly well suited to the underlying logic of CA (Greenacre 1988, 41), whose algorithm can be described as follows (Greenacre 2007, 116): rows (or columns) are progressively aggregated in a way in which every successive merging produces the smallest change in the table's inertia, and this process goes on until the table is reduced to just one row “consisting of the marginal columns of the original table” (Greenacre 2007, 116, 117 fig. 15.4). The same applies to columns. The underlying logic lies in the fact that rows (or columns) whose merging produces a small change in table’s inertia have similar profiles. This procedure can be thought of as maximizing the between-group inertia and minimizing the within-group inertia (Greenacre 2007, 116). The successive merging of rows (or columns) can be graphically depicted as a dendrogram. Each level at which the merging occurs corresponds to the associated reduction of the table’s inertia.
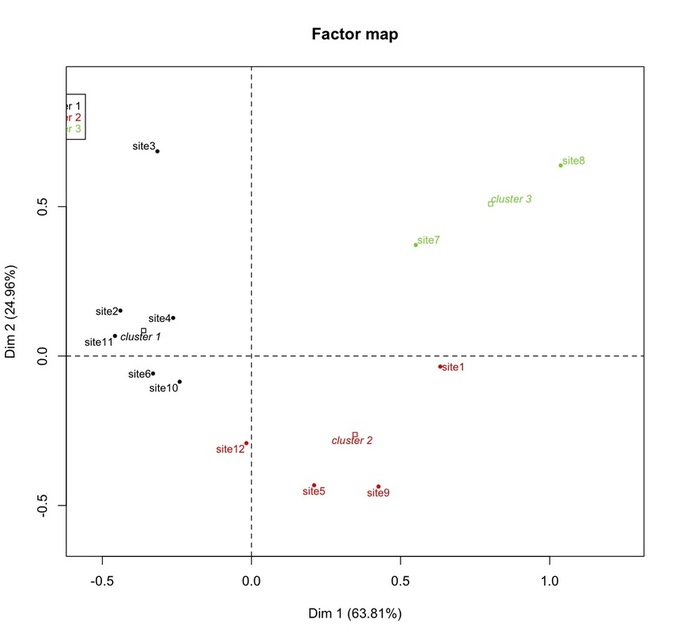
A method essentially similar is that provided by the ‘FactoMineR’ package (Lê et al. 2008; Husson et al. 2010; 2011, 177-185) used by the script. It returns three plots: the first is the CA scatterplot with points (in our example, row profile points) coloured on the basis of the clusters they belong to.
Greenacre (1988; 2007, 113-120) describes a method particularly well suited to the underlying logic of CA (Greenacre 1988, 41), whose algorithm can be described as follows (Greenacre 2007, 116): rows (or columns) are progressively aggregated in a way in which every successive merging produces the smallest change in the table's inertia, and this process goes on until the table is reduced to just one row “consisting of the marginal columns of the original table” (Greenacre 2007, 116, 117 fig. 15.4). The same applies to columns. The underlying logic lies in the fact that rows (or columns) whose merging produces a small change in table’s inertia have similar profiles. This procedure can be thought of as maximizing the between-group inertia and minimizing the within-group inertia (Greenacre 2007, 116). The successive merging of rows (or columns) can be graphically depicted as a dendrogram. Each level at which the merging occurs corresponds to the associated reduction of the table’s inertia.
A method essentially similar is that provided by the ‘FactoMineR’ package (Lê et al. 2008; Husson et al. 2010; 2011, 177-185) used by the script. It returns three plots: the first is the CA scatterplot with points (in our example, row profile points) coloured on the basis of the clusters they belong to.
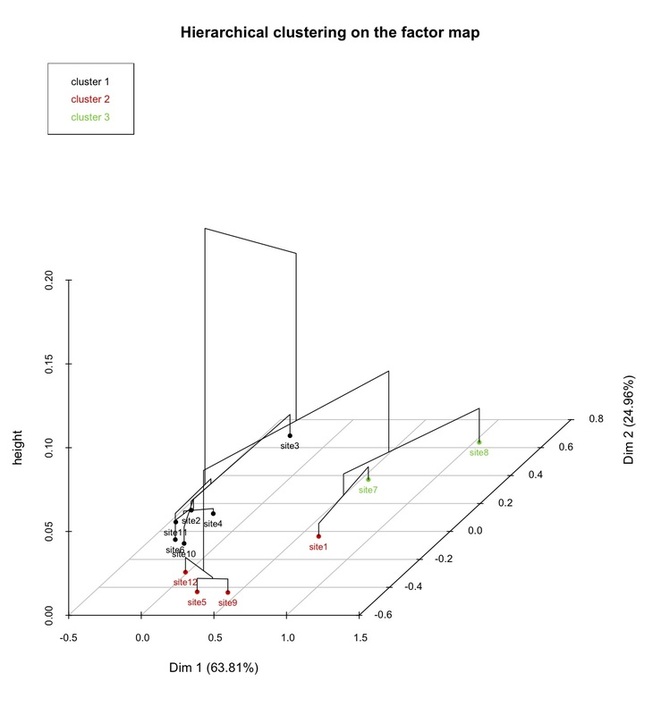
The second is quite similar, with the clusters tree plotted directly onto the scatterplot.
The third is the clusters tree with the optimal level of division indicated by coloured boxes.
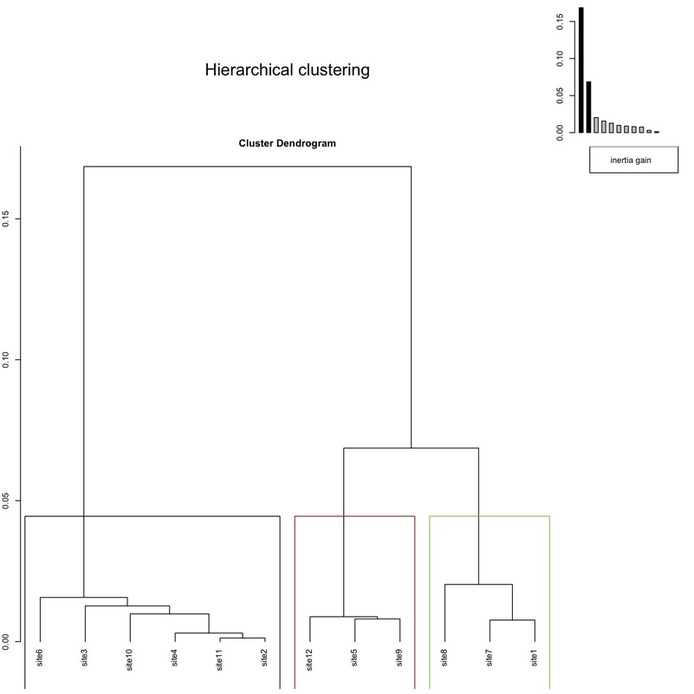
Even though different approaches exist in cluster analysis to decide how many clusters can be read out of the results (i.e., cutting the dendrogram at a particular height), ranging from informal (Drennan 2009, 316) to formal ones (so-called “stopping rules”; see e.g. Milligan, Cooper 1985, 163-167; overview in Baxter 1994, 161-165; Everitt et al. 2011, 95-96), and acknowledging the fact that the problem is a difficult one for which no completely satisfactory solution exists (Baxter 1994, 162), ‘FactoMineR’ natively suggests an optimal partition. While its mathematical details are beyond the scope of this article (and I refer the reader to the references provided), suffices here to say that, as made clear by Husson et al. (2011, 185), a division into Q (i.e., a given number of) clusters is suggested when the increase in between-group inertia attained when passing from a Q-1 to a Q partition is greater than that from a Q to a Q+1 clusters partition. In other words, during the process of rows (or columns) merging, if the following aggregation raises highly the within-group inertia, it means that at the further step very different profile are being aggregated.
To keep with our fictional example, this means that the sites belonging to the same cluster (2, 3, 4, 6, 10, 11; 5, 9, 12; 1, 7, 8) are those with more similar profiles. Referring back to the original contingency table, those rows could be collapsed into two distinct groups, and this would produce the least decrease in the table’s inertia since, as said, the sites belonging to those two groups have the more similar profiles in terms of pottery types. This could be relevant for the sake of any further archaeological interpretation since it could provide the bases to hypothesize, for instance, that the sites could represent two different chronological horizons, or could belong to two different cultural traditions, and so forth.
To keep with our fictional example, this means that the sites belonging to the same cluster (2, 3, 4, 6, 10, 11; 5, 9, 12; 1, 7, 8) are those with more similar profiles. Referring back to the original contingency table, those rows could be collapsed into two distinct groups, and this would produce the least decrease in the table’s inertia since, as said, the sites belonging to those two groups have the more similar profiles in terms of pottery types. This could be relevant for the sake of any further archaeological interpretation since it could provide the bases to hypothesize, for instance, that the sites could represent two different chronological horizons, or could belong to two different cultural traditions, and so forth.
Have you found this website helpful? Consider to leave a comment in this page.
