Interpreting the CA scatterplot: dimensions interpretation
|
The script provides the symmetric plots (rows and columns; rows only, columns only) for the first four dimensions. The plots are obtained from the ‘ca’ package. The plot, showing the row (point) and column (triangle) profile points at the same time, is reproduced.

To interpret the plot it is useful to clarify that we are interested in interpreting the relative position of the row points in the space defined by the columns. In other words, we seek to understand the similarity of the sites on the basis of the proportion of pottery types present in each location. The next step for the interpretation is to assess what column category (i.e., type) is actually determining the dimensions. In a sense, we are going to give “names” to the dimensions.
To accomplish this, two ways are made available by the script. The first is to inspect the bar plot. The contribution (in permills) of pottery types to the definition of the first four dimensions is displayed. The reference line indicates the threshold (average contribution) above which any contribution has to be considered important for the definition of that dimension (Greenacre 2007, 82).
To accomplish this, two ways are made available by the script. The first is to inspect the bar plot. The contribution (in permills) of pottery types to the definition of the first four dimensions is displayed. The reference line indicates the threshold (average contribution) above which any contribution has to be considered important for the definition of that dimension (Greenacre 2007, 82).
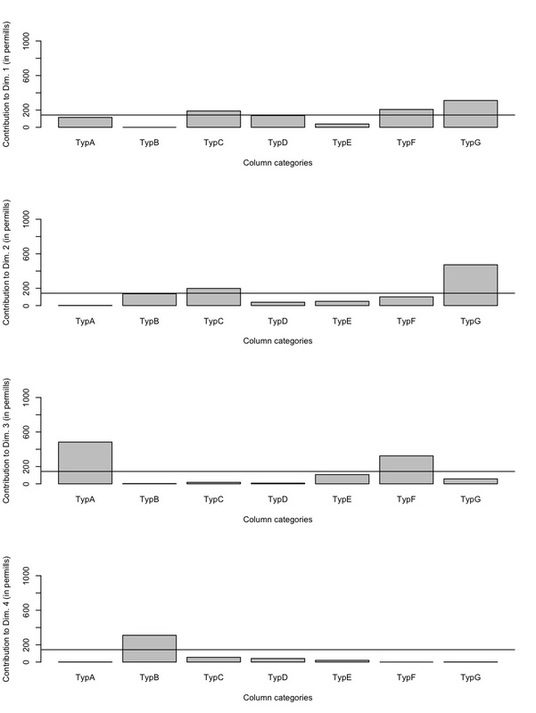
It can be seen that type C, F, and G have a major role in the definition of the first dimension, with the first and last of the three also having a large contribution to the second dimension. Incidentally, it must be noted that type A and B have a large contribution only to the third and fourth dimension. Should the analyst be interested in those pottery types, he can proceed to inspect the other plots provided by the script, representing the first dimension and the third or the fourth one.
The second option is the Standard Biplot (see also its use as discussed later in this site) provided by the ‘ca’ package.
The second option is the Standard Biplot (see also its use as discussed later in this site) provided by the ‘ca’ package.
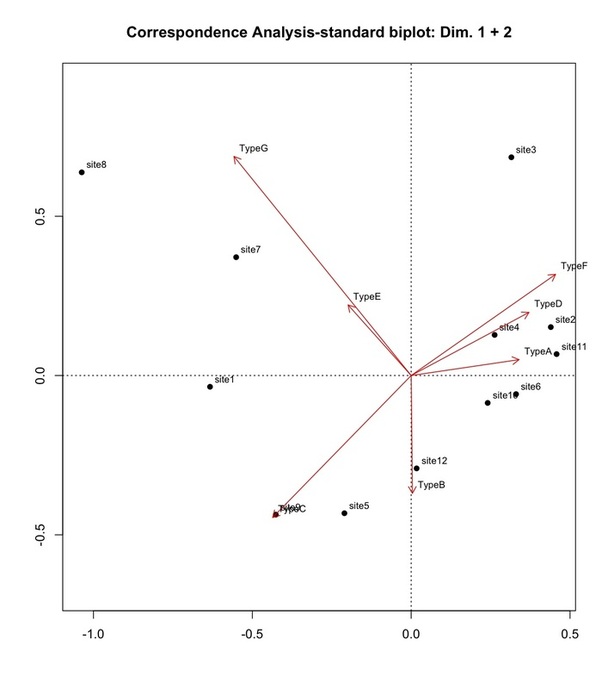
In this plot, while the position of the row profile points is unchanged, the distances of the column points from the centroid are related to the contribution that each column category gives the principal axes (Greenacre 2007, 101-103, 268-270). Besides, the closer an arrow is (in terms of angular distance) to an axis (or to a pole thereof) the greater is the contribution of the column category on that axis relative to the other axis. If the arrow is halfway between the two, its column category contributes to the two axes to the same extent. It is evident that type F has a major contribution to the positive pole of the first dimension, while type C and G have a major contribution to the definition of both the first and second dimension. In this respect, while C and G both contribute to the negative pole of the first dimension, they contribute to different poles of the second dimension, the negative and the positive one respectively.
Have you found this website helpful? Consider to leave a comment in this page.
