Association between Rows and Columns
|
|
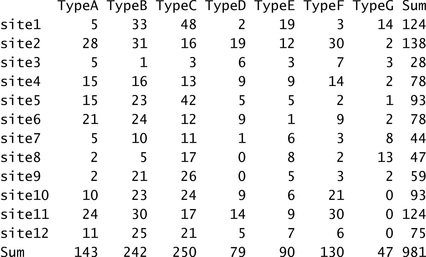
For illustrative purposes, a contingency table is created with 12 rows and 7 columns. It represents the fictional distribution of seven pottery types across twelve sites. The analyst’s interest could lie in understanding if a correspondence exists between sites and pottery types; in other words, whether types are evenly distributed across sites, or if a pattern of association exists between sites and types. This will be accomplished by means of CA.
The preliminary interest could be in the strength of association between rows and columns of the table. This information is provided by a bar chart.It shows the magnitude of the correlation coefficient on the right side, compared with the overall range (0.0-1.0) of the coefficient (on the left). A reference line indicates the threshold (0.20) above which the correlation can be considered important (Bendixen 1995, 576; Healey 2013, 289-290).
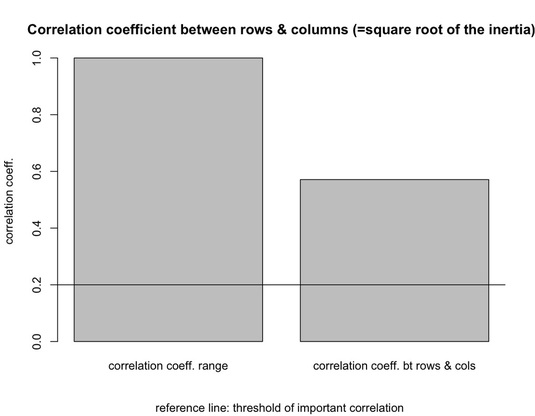
It should be noted that the correlation coefficient is the square root of the table’s inertia, and it turns out to correspond to the phi coefficient used to measure the strength of association between two categorical variables (Greenacre 2007, 28, 61). In our example, the correlation coefficient is equal to 0.57 pointing to a strong association (Healey 2013, 289). It should be also noted that the existence of a significant dependence between rows and columns could be tested via the chi-square test (on this test see, Cool, Baxter 2005; Drennan 2009, 182-188). In in our case turns out to be significant (chi-square: 319.92; df: 66; p: < 0.001).
Have you found this website helpful? Consider to leave a comment in this page.
